Dynamic visualization capabilities
PyDSS uses Bokeh (https://docs.bokeh.org/en/latest/index.html) to render dynamic visuals. The visuals update as the simulatons runs, thus allowing user debug control algorithms, gain deeper insights and demonstate results in richer interactive manner. OpenDSS has limited visualization capabilities and does not support dynamic visuals.
The installation come with seven plots listed below.
Frequency sweep plot
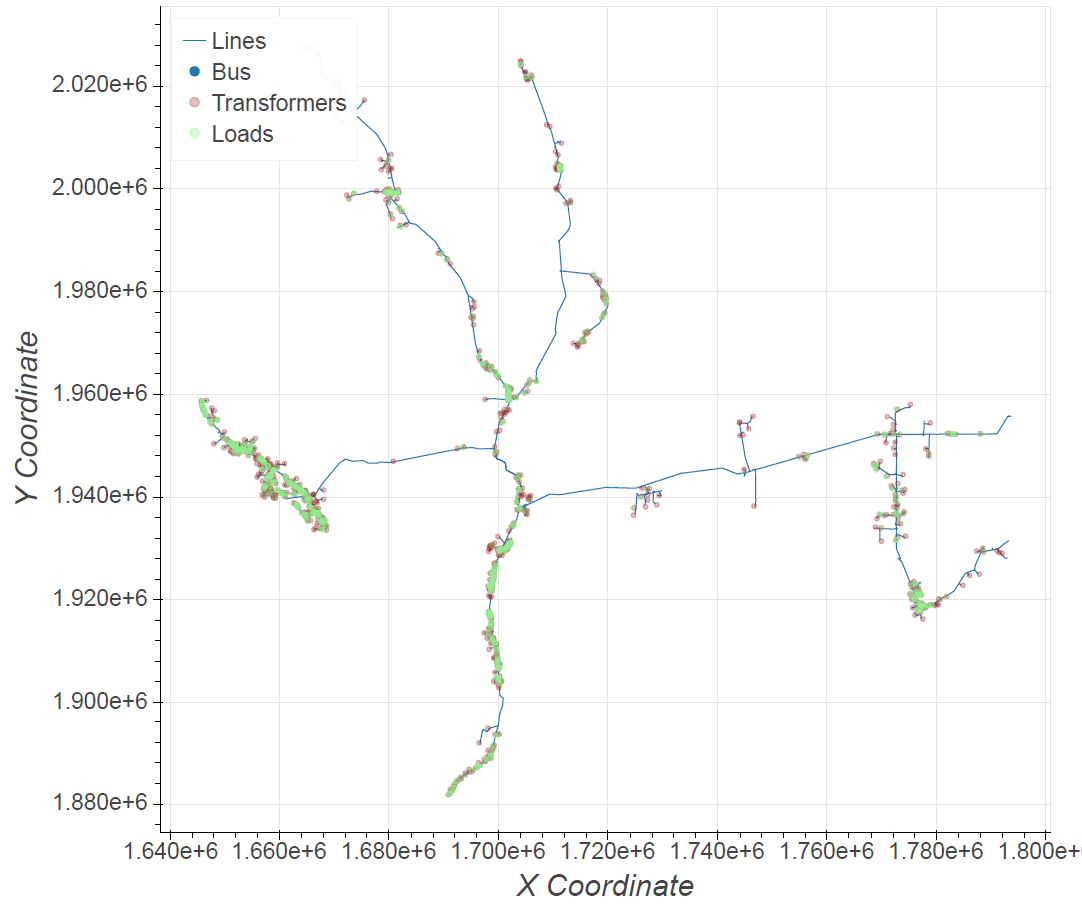
GIS plot
Histogram plot
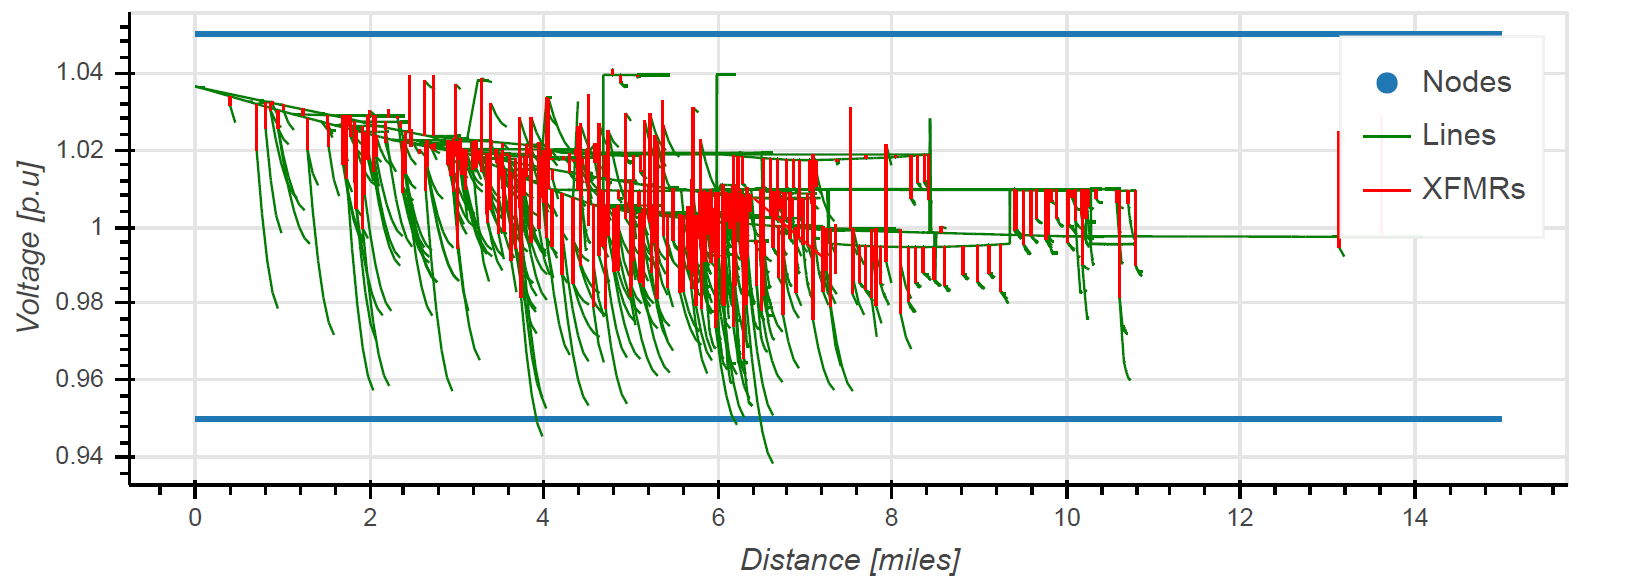
Voltage sag plot
Time series plot
Voltage / Current heatmap plot
XY plots
To enable dynamic plotting, two settings list below need to populated in the ‘Scenario_settings.TOML’ file.
"Create dynamic plots" = false
"Open plots in browser" = true
Create dynamic plots- [Bool] - Enable rendering of dynamic plots using bokeh. If set to true, an instance of bokeh server is run to render plots before the simulation stats.
Open plots in browser- [Bool] - If set to true, open plots in the default browser automatically. Will only work “Create dynamic plots” is set to true.
Plot need to be defined within the ‘pyPlotList.json’ file for a given scenario. ‘Bokeh-Visualization’ project within the examples folder provide template to define each of the seven plots. Multiple plots may be created for a given scenario. All plots ate interactive and allow user to zoom, scroll, hide layers and save images as png files.
FileName |
Path |
Width |
Height |
|---|---|---|---|
Network layout.html |
None |
1400 |
850 |
FileName |
Phase |
Vlb |
Vub |
Width |
Height |
Dmax |
Voltage Level |
|---|---|---|---|---|---|---|---|
Voltage_sag_plot.html |
0 |
0.95 |
1.05 |
1400 |
800 |
15 |
All |
Expected definations for each plot can be found here
Users are able to extend current plotting capabilites by following the tutorial here